What's New From RightCapital in the Second Quarter of 2024?
July 1, 2024

Key Takeaways
- With RightRisk, advisors and clients can view, compare, and analyze risk tolerance scores against current portfolios, target portfolios, and major asset classes, all without a separate third-party tool.
- RightRisk is built for flexibility and client engagement. Use the default 13-item questionnaire or build your own.
- There was also a range of smaller but impactful updates, including custom vesting schedules, a new gain/loss column for holdings, a redesigned Net Worth tab, expanded asset and liability limits, and firm-level inflation and assumption controls.
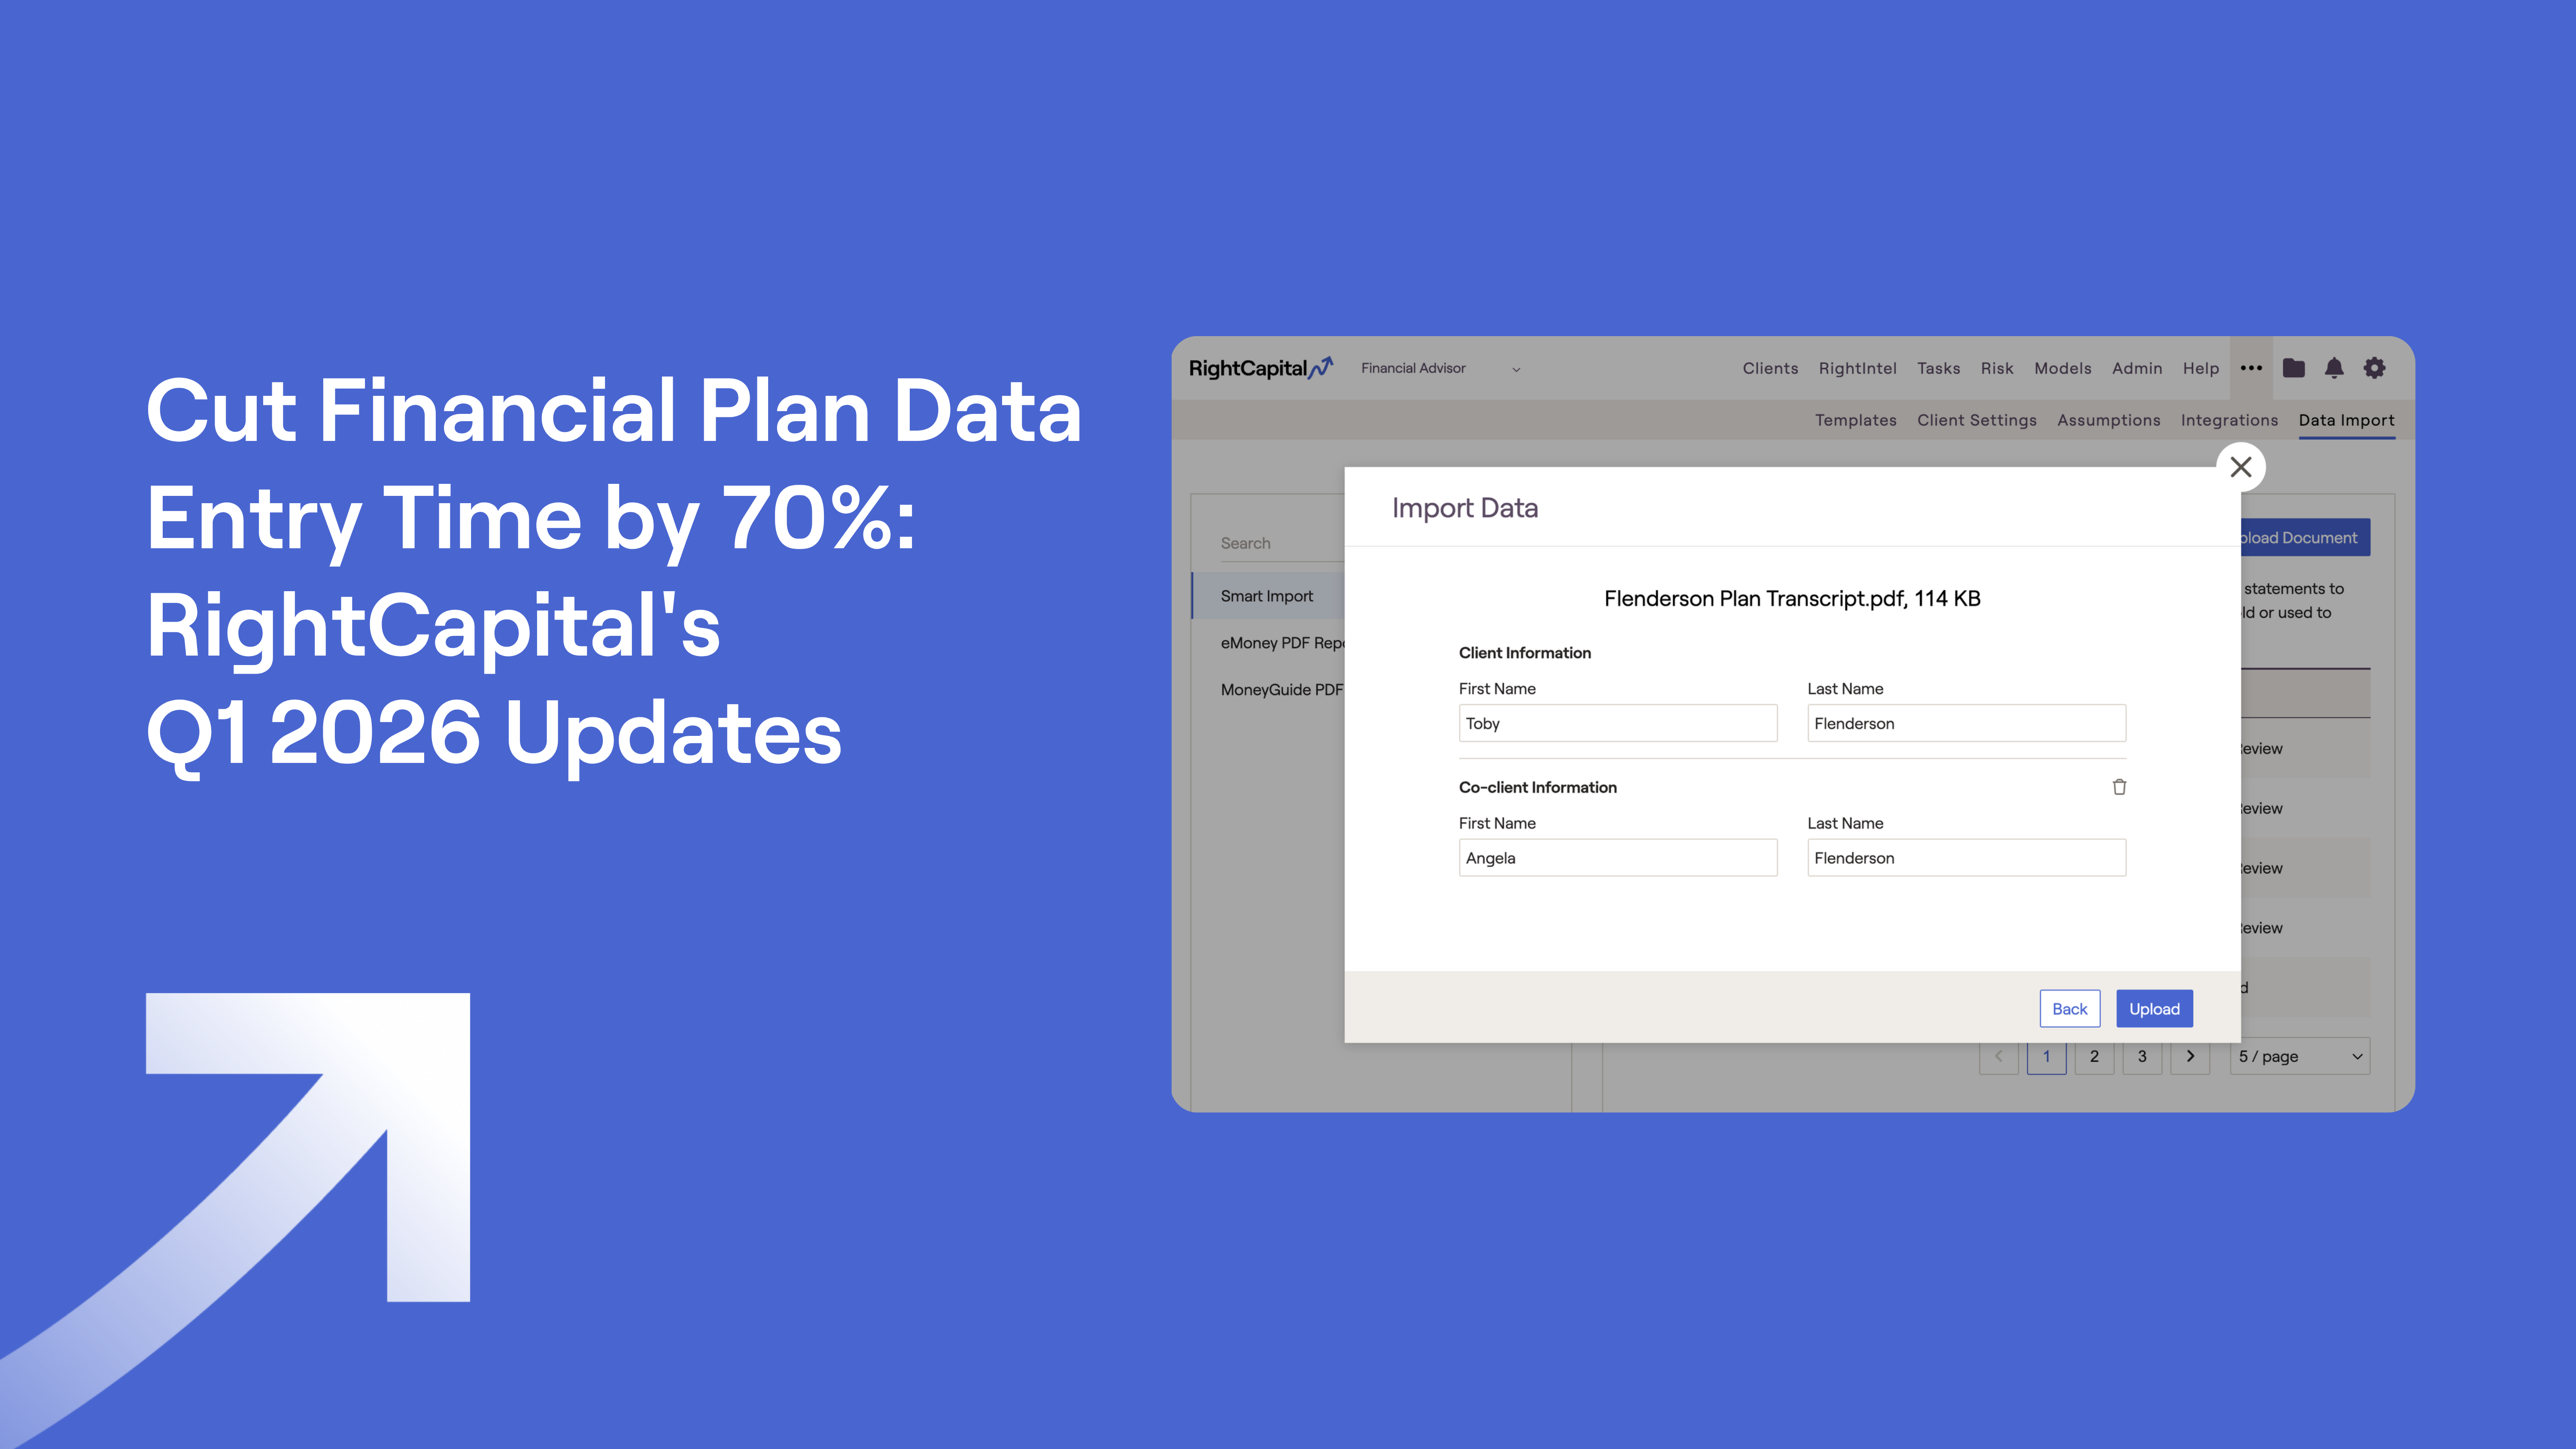
Looking for the most recent updates? Here are RightCapital’s Most Exciting Enhancements in 2025.
Can you believe we are halfway through the year already? Time has been flying and so have the updates from RightCapital. Here are our biggest enhancements over the last three months, including the introduction of RightRisk, an innovative risk assessment module with customizable questionnaires, built right into our financial planning software:
RightRisk™, a fully integrated risk assessment module
We are excited to introduce RightRisk, a new risk assessment tool that's fully integrated into RightCapital's financial planning software. With RightRisk, it's easier than ever to show how a risk tolerance score relates to investment portfolios and the probability of success. Let's dive in.
In the client portal, under Investment, you'll find a new Risk tab. The Summary tab comes with three charts. The first chart, the risk summary, shows how the household risk score compares to their current and target portfolios. For your convenience, you can update the target portfolio using the dropdown menu. Here, you can also exclude any investment accounts from the analysis by just opening up the action items, clicking edit, and unchecking those specific accounts.
The risk comparison chart shows the household risk score along with other major asset classes like money market, corporate bonds, and large growth funds. The household risk classification is an optional chart that shows where the risk score falls within the customized risk categories created by the advisor. In this example, we're showing high, medium, and low, but I'll show you where you can customize them later in the advisor portal.
Let's jump to the analysis tab. You can use this visual to help clients understand the potential upside and downside for their current and target investment portfolios and how they compare to other major asset classes.
From the score and assessments tab, you as the advisor can set the risk score for your client household by clicking the set risk score button. As you move the cursor across the scale, you'll see the list of your model portfolios that fall within a 10-point range of that score. For this particular household, let's assume the risk score of 70 based on the assessments the client has taken previously and the conversations I've had with them.
Let's also go ahead and assign a new risk questionnaire to this client. By default, we include a 13-item questionnaire based on the Grable and Lytton scale, a well-known industry standard, but you can also create your own questionnaire, which we'll go over later in the advisor portal. You can click the start button to launch the questionnaire immediately and review it with the client during a live meeting, or you can press the save button, which will show a splash screen the next time the client logs into the portal reminding them to take the questionnaire.
Lastly, the details tab displays the household's investment accounts and their account specific risk scores, which are calculated based on their standard deviation.
Now let's switch to the advisor portal, where you'll also see the new Risk tab. On the Household tab, you can see the roundup of the risk scores for all your client households and their current portfolios in one place. The Portfolio tab provides a detailed view of the advisor's model portfolios, including their expected return, standard deviation, potential downside and upside, and where they fall within the custom risk categories that you've created.
On the Questionnaires tab, you can edit the default Grable and Lytton questionnaire we provided or add a new questionnaire. Let's go ahead and create a sample questionnaire together. After you've applied a risk value to all the responses, they will be automatically normalized on a scale of one to 100. Once you're done editing the questionnaire, don't forget to press the publish button.
The Categories tab is an optional feature where you can create your own risk categories and ranges to display in your client's risk analysis. To enable or disable this feature, toggle the enable button. By default, we've added low, medium, and high categories, but you can create a new risk category and range by clicking on the risk scale.
Now, let's talk about other ways to share RightRisk with clients. You can of course add the household risk score and risk summary to the Snapshot dashboard and also include them as part of the PDF report.
You might be wondering if there's a cost associated with RightRisk. If you're already on our premium subscription or higher, RightRisk is included for free.
Thank you for joining us for our overview of the new RightRisk module, and please let us know what you think.
RightRisk is a new module that simplifies how you incorporate risk assessments into your financial plans. RightRisk allows you and your clients to view, compare, and analyze risk tolerance scores, all within RightCapital. Key highlights include:
Household risk summary: See how a household risk score compares to its current portfolio, target portfolio, and major asset classes. You can also create custom risk categories to enhance this visual comparison.
Visual risk-return analysis: Help clients easily understand the potential upside and downside returns for their investment portfolios and major asset classes.
Customizable questionnaires: Use our default 13-item questionnaire based on the Grable and Lytton scale or create your own version. Copy existing questionnaires to create new ones.
Flexible ways to engage with clients: Launch the questionnaire immediately during a live client meeting or save it for the client to take later. You can also include the risk score and summary as part of the client’s Snapshot Dashboard or PDF report.
RightRisk is included with RightCapital’s Premium subscription level or higher.
Additional product updates from Q2
RightRisk was definitely our most transformative addition this quarter, but that's not all. Here are a few smaller but impactful updates to help make your financial planning processes easier:
More flexibility with vesting schedules: Advisors can more accurately portray client's vesting schedules by creating custom vesting schedules on an annual, semi-annual, quarterly, and monthly basis.
New gain/loss column for investment holdings: There is a new column in the Investment > Holdings table to easily view any gains or losses for respective accounts. You can sort the Holdings table by the new column and export the data as part of the CSV download.
Redesign of Net Worth: The Net Worth tab has been refreshed for a more modern look and to make it easier to organize the client data. Advisors with account aggregation will also see a Connections panel in the client’s Net Worth tab that displays all connections, the status of each connection, and the number of linked accounts.
Integration with Flourish: We were thrilled to add Flourish to our roster of integration partners. Bring in cash account balances and annuity contract data directly from Flourish into RightCapital's Net Worth tab with just a few clicks. The positions and values will be updated Tuesday through Saturday morning with the previous day’s closing value.
Increase in number of assets and liabilities: To accommodate clients with a significant number of properties, loans, businesses, or other assets, we have expanded the maximum number of each to 100.
Default visibility for tasks and notes: Advisors can specify if newly created tasks and notes will default to "not visible" to the client or "not shared" with the client within Advisor Portal > Preferences. If your firm has RightFlows enabled, super admins can update the preference for new RightFlows tasks in RightFlows > Settings > Preferences.
Extended timeframe for budget expenses: The budget expenses chart in Snapshot and the mobile app now reflects the selected timeframe from the Budget module.
Emojis in the PDF reports: If you love emojis as much as we do, you're in luck. Our PDF reports will now include emojis you've added throughout the plan.
Annual college cost update: The national averages as well as specific college costs have been updated with the latest 2023 data, which will be reflected in your existing financial plans that contain college goals.
Firm-level inflation and miscellaneous assumption controls: The super admin of an org can now enable firm-level inflation and miscellaneous assumptions. When enabled, they can also elect if firm members can use their own assumptions or if they need to use the firm's assumptions.
Do you wish your financial planning software solution provided updates and enhancements on a more frequent basis? Schedule a demo with RightCapital today.


