It's that time of year again, filled with sunny barbecues, summer camps for the kids, and a recap of what RightCapital has been up to over the past quarter. Here are some of our most exciting premieres since April:
Visualizations of client inflows and outflows

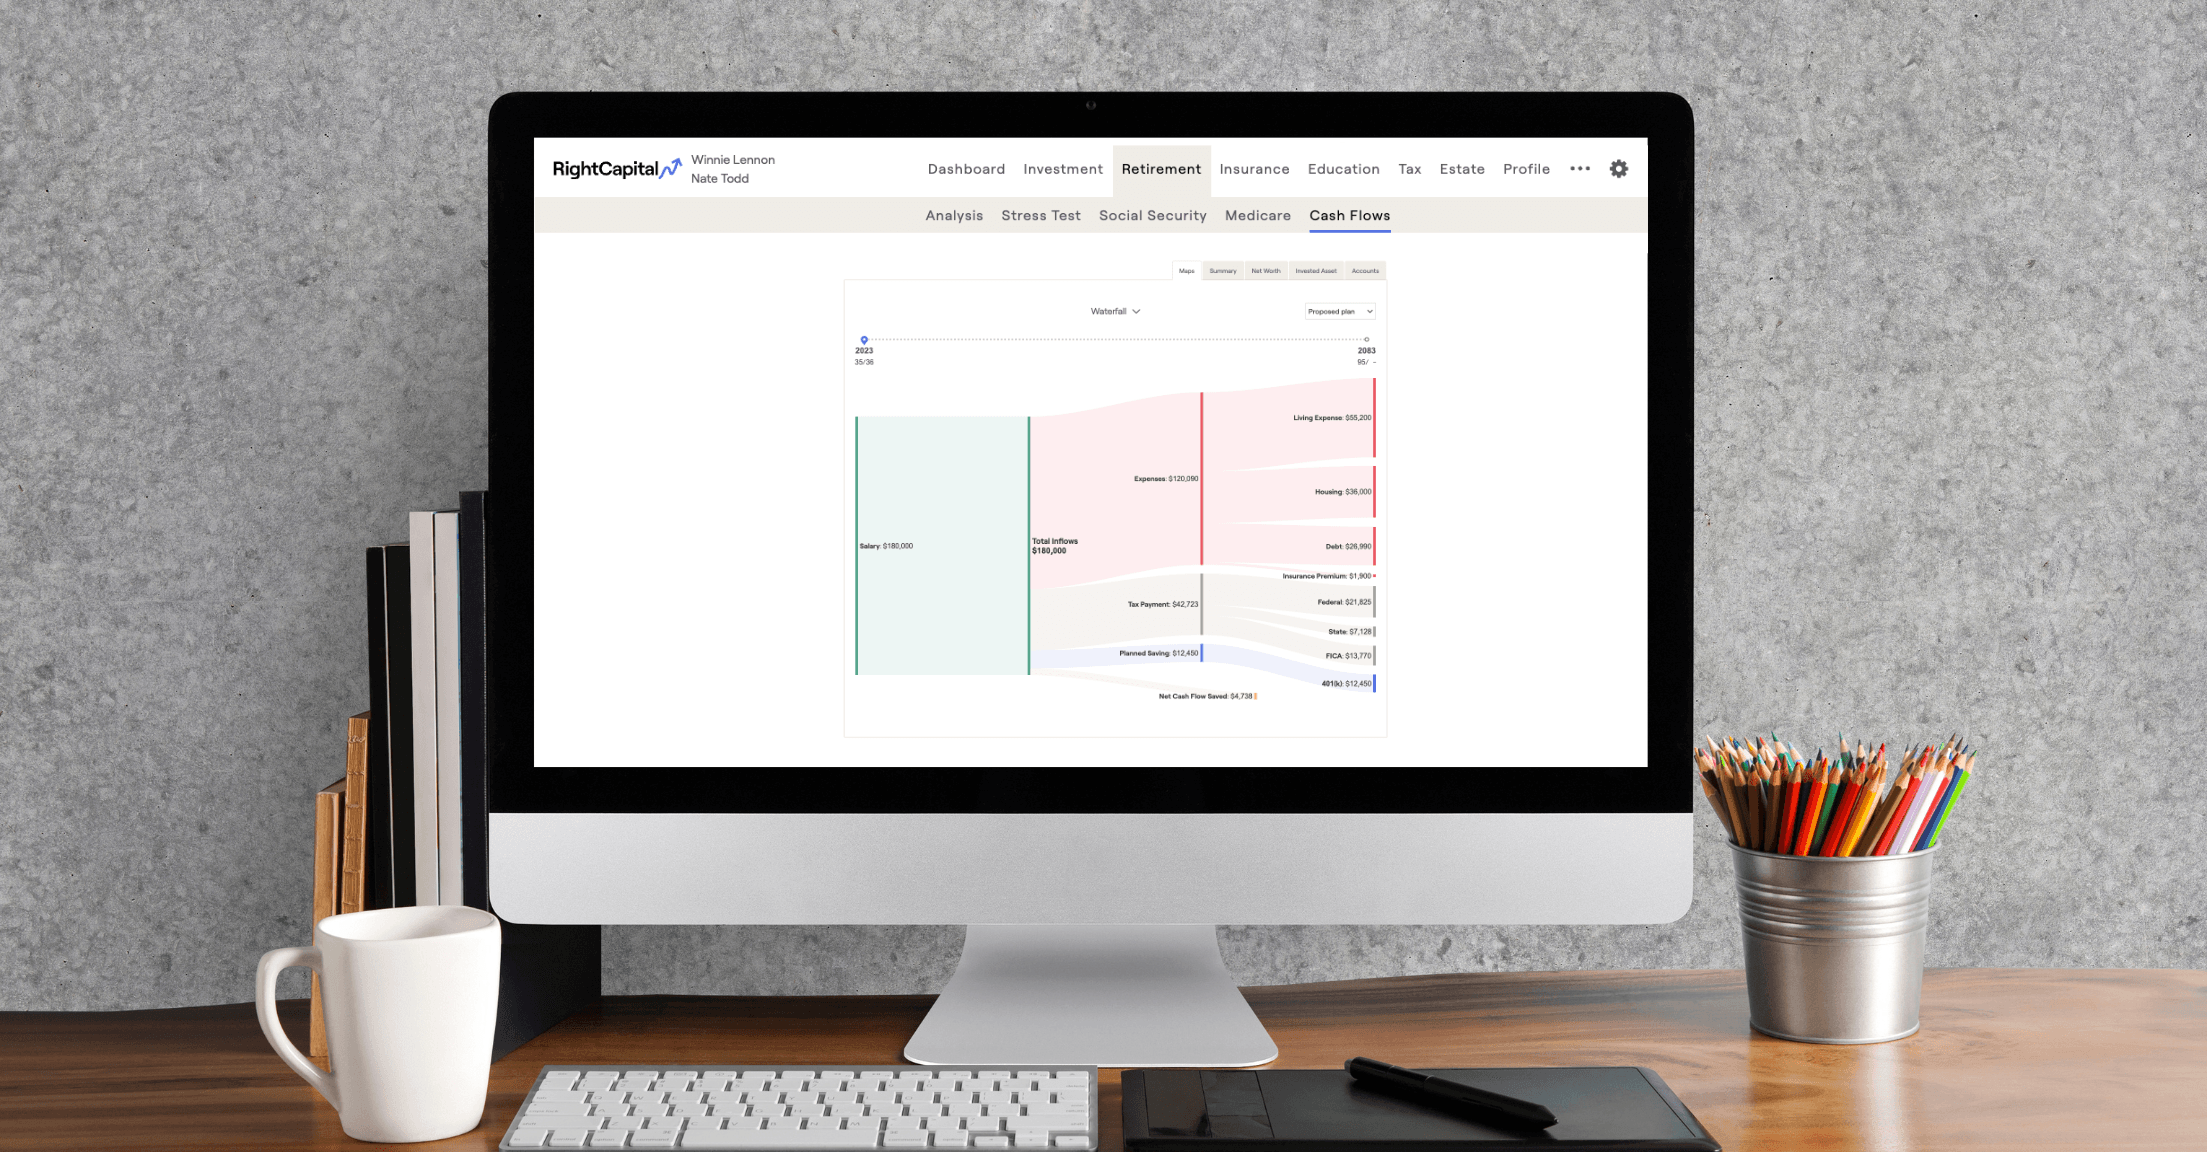
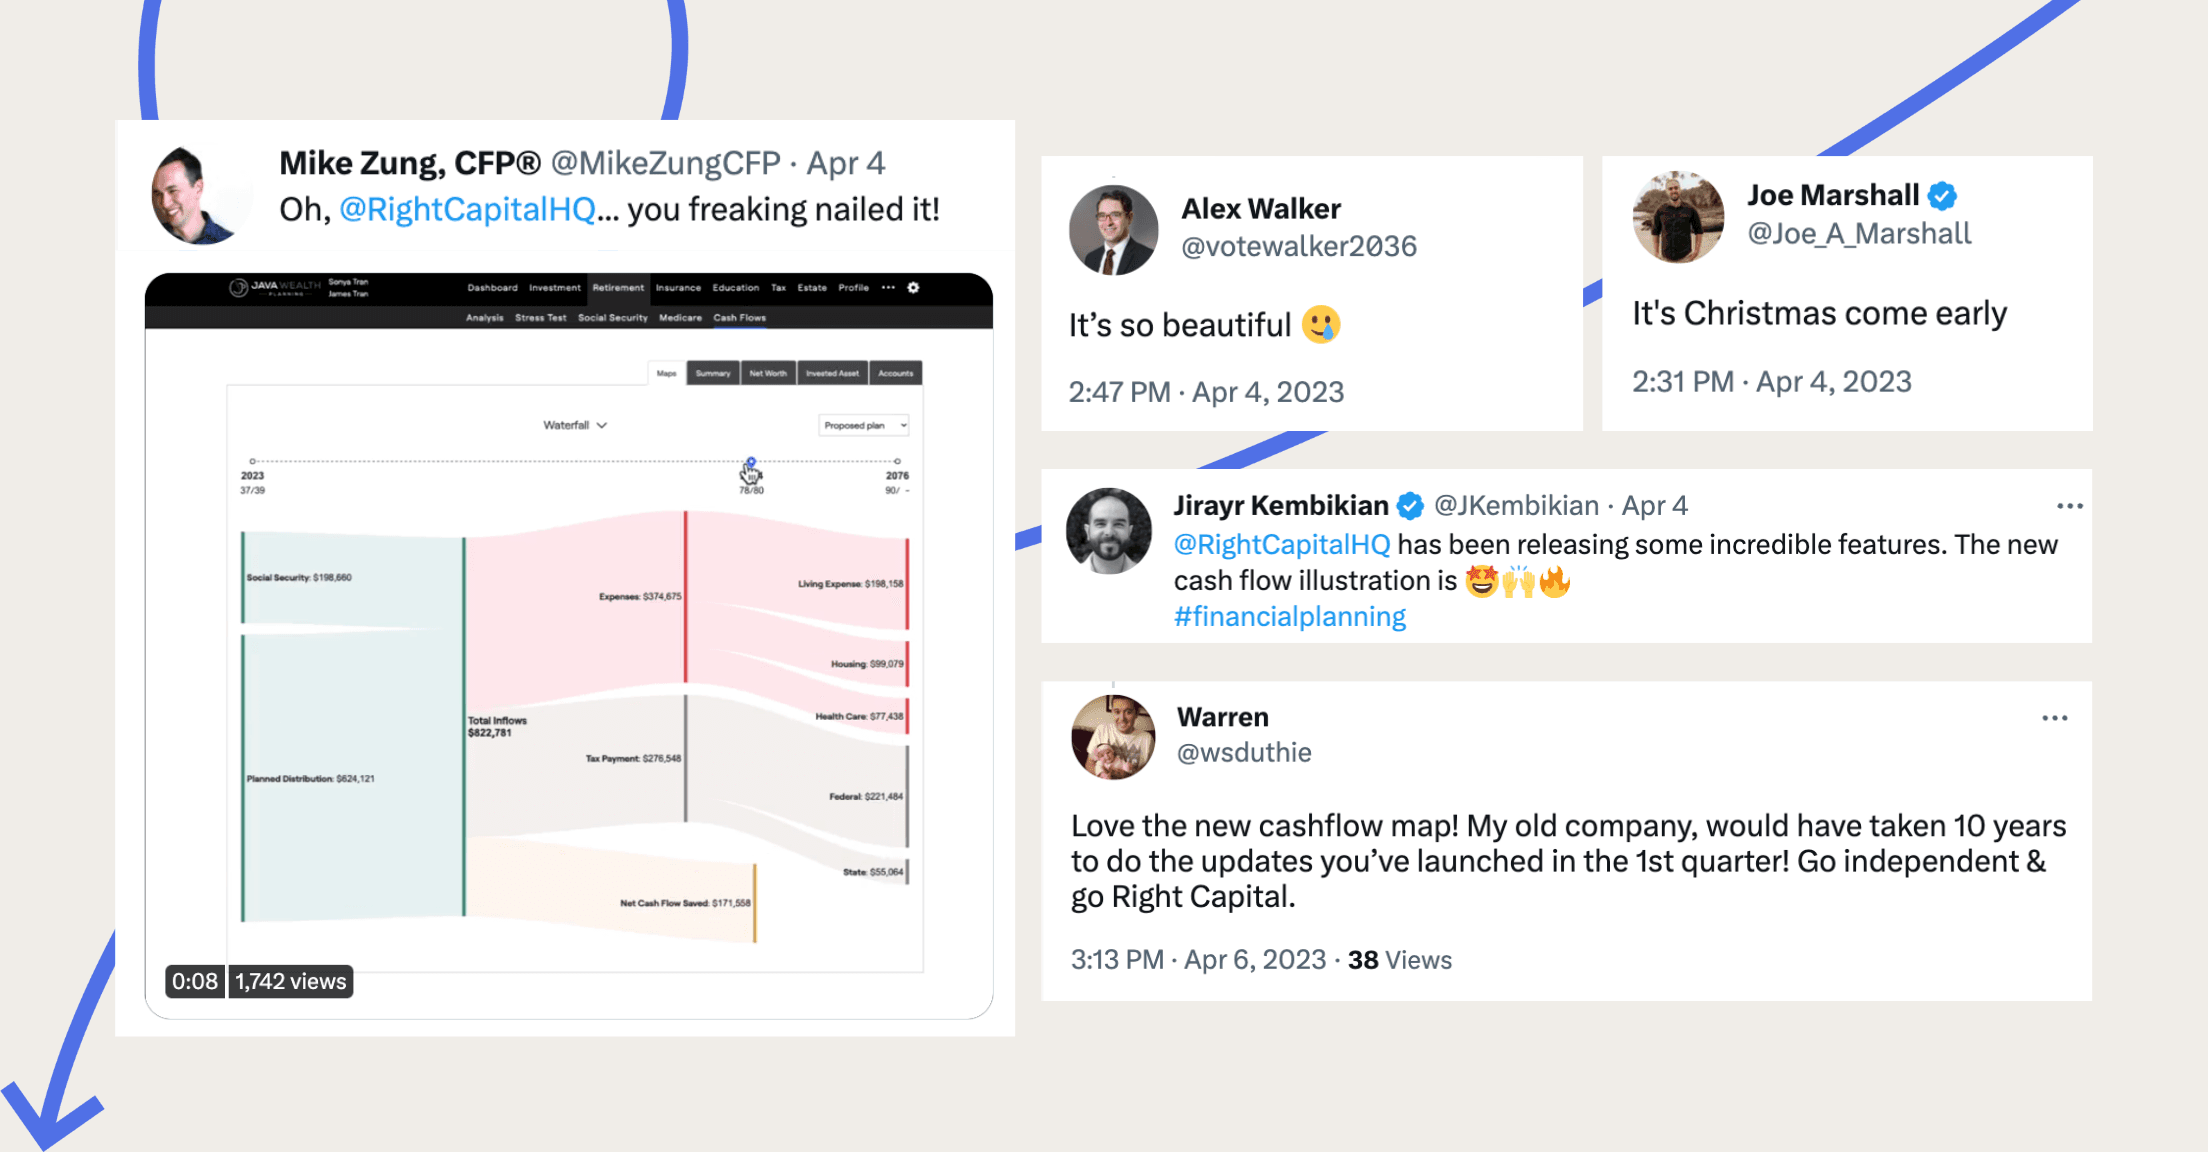
Social media was abuzz when they discovered our newest data visualizations, Cash Flow Maps, created to illustrate client’s cash inflows and outflows in easy-to-understand diagrams. There are two cash flow visuals, a “Waterfall” horizontal Sankey chart where cash inflows and outflows progress from left to right and “Breakdown,” a vertical flow chart where each item can be clicked into for more details. Interested in seeing these visuals in action? Watch this 90-second overview.
Budget module overhaul
Earlier in the year, our budget module had a bit of a revamp to help drive more value for your planning services, and the hits kept coming in Q2 thanks to recommendations from our advisors. New charts and streamlined budget creation are now available within the module for clients. They can more easily track spending against their goals and analyze spending for each budget category. The platform now defaults to the most recently selected time period for quick budget reviews and for consistency on the PDF report. Exclude certain bank and credit card accounts easily from the budget analysis without removing them from the financial plan.
Investment module enhancements
Advisors now have more insight into asset allocation. View the Current Asset Allocation using the new "Groups" or "Customized" filters. Groups can represent a variety of categories such as accounts by owner and tax status or a customized selection. Furthermore, Morningstar-recognized tickers within the Investment account (Profile > Net Worth) will populate a pie chart showing asset allocation.
Planning access flexibility
Not only can you rearrange the order of different modules within each client’s individual planning access, you can now drag and drop the sub-tabs within the Retirement and Cash Flow modules. This update provides the ability to further personalize each client’s access, if, for example, a younger client of yours is more focused on the Savings tab than the Probability tab.
PDF report improvements
More detail is visible on the PDF report, such as the designation of task priority level, client/co-client ages within Cash Flow Maps, and probability of success for each bar on the Stress Test chart. In the Retirement > Analysis > Confidence chart, the legends you've selected (e.g., 5-95% Confidence Level) will be saved and reflected in the report.
Team collaboration
Lastly, if your firm is using team collaboration, users can now easily download a CSV file record of team structures within the firm. This can be done by visiting Advisor Portal > Gear Icon ⚙ > Teams tab.
Do you wish your financial planning software solution provided updates and enhancements monthly? Schedule a demo with RightCapital today.