Financial Dashboard Customization for Advisors
May 2, 2025


Key Takeaways
- Financial dashboards turn complex data into client-friendly visuals that drive better conversations. From cash flow maps and tax savings analyses to debt management and budgeting views, the right dashboard helps clients quickly understand where they stand and what actions to take.
- Customizable, one-page plan summaries save advisors time and create consistency across clients. RightCapital's Snapshot allows advisors to pull key metrics into a single view, with reusable templates so you're not rebuilding from scratch for every household.
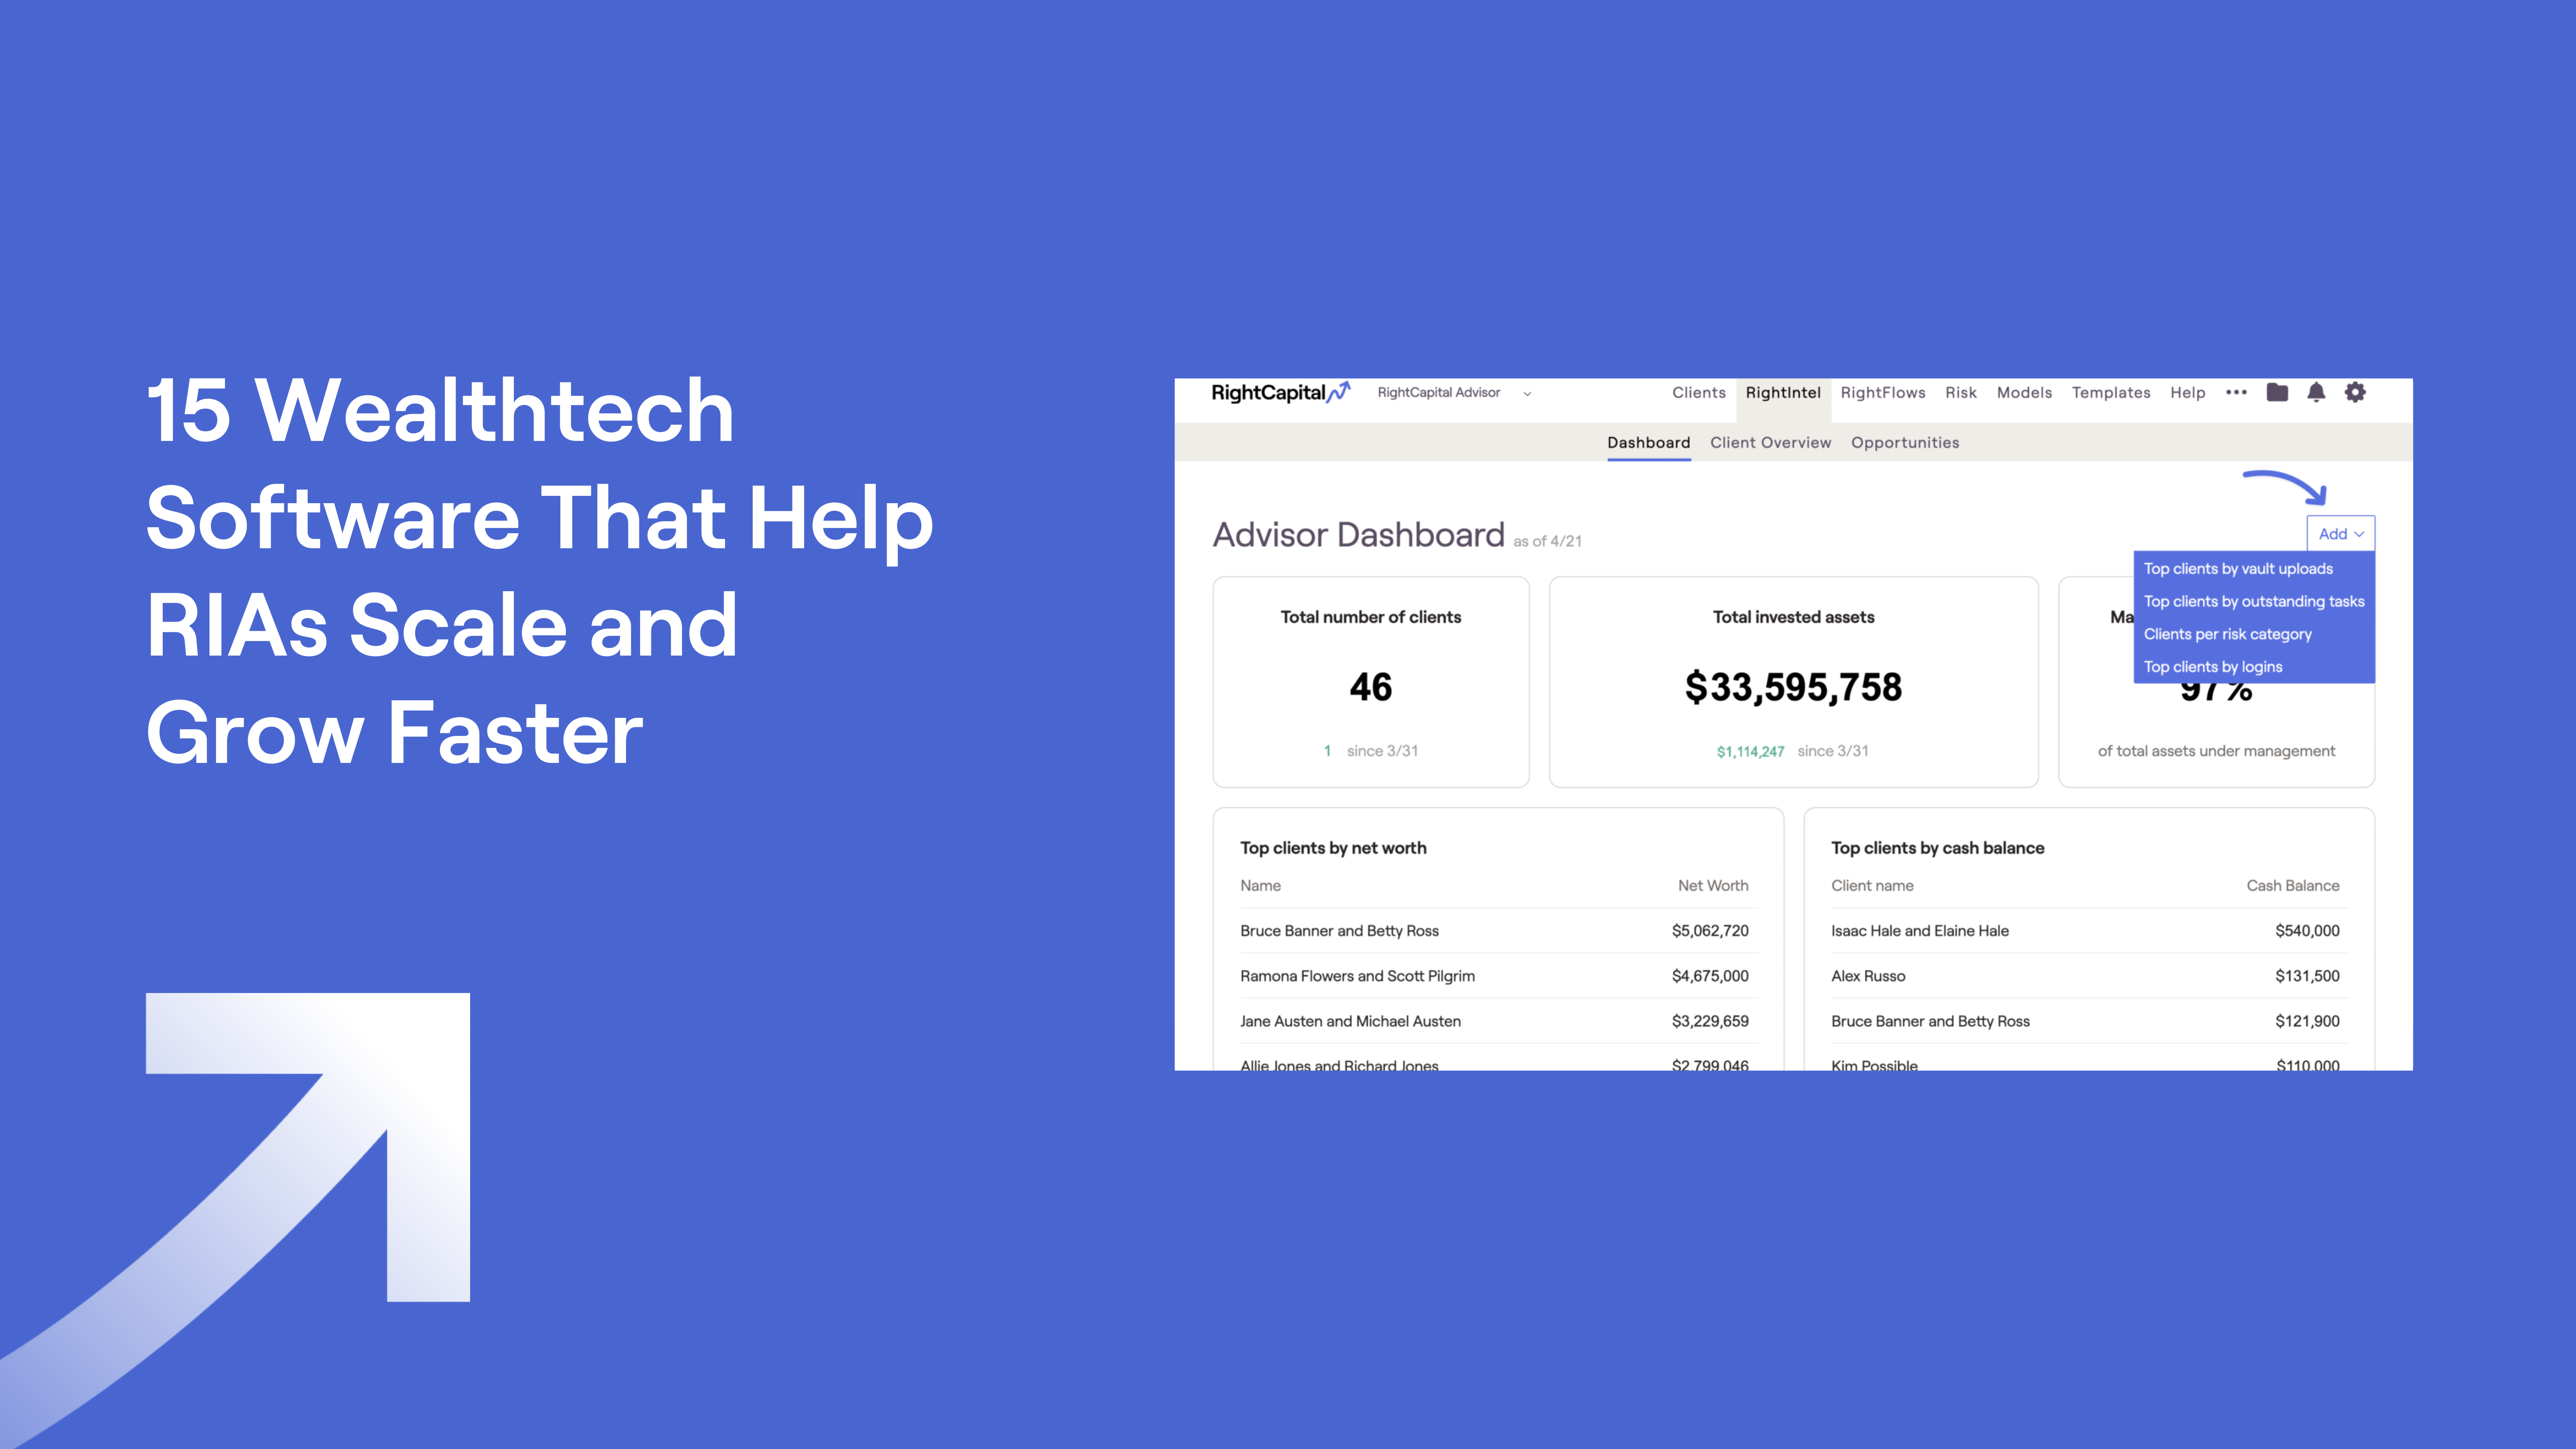
- Dashboards aren't just for clients; business intelligence views help advisors manage their own practices. RightCapital's RightIntel aggregates firm-level metrics such as total invested assets, client demographics, and portal engagement, giving advisors real-time insights into their books of business.
Financial advisors know that clear communication is the foundation of a strong client relationship. Yet, translating complex financial data into actionable insights can be challenging—especially when clients have varying levels of financial literacy. If you’re searching for ways to make financial strategies and scenarios more accessible, financial dashboards are your secret weapon.
In this article, you’ll discover actionable tips and real-world examples of client-facing financial dashboards. This post will showcase how RightCapital’s versions of these visuals can help you simplify the conversation, address client concerns, and deliver a more engaging planning experience to help clients with decision-making.
Just a note that while the below visualizations are in general spoken about as “financial dashboards,” these are not to be confused with RightCapital’s “Dashboard” section, which is how you navigate to our personalized plan summary Snapshot as well as the Balance Sheet, Liquidity, Budget, and Tasks modules.
14 Financial dashboard examples to enhance client clarity
Financial dashboards transform raw data into visual stories, making it easier for clients to understand their individual financial pictures. Below 14 user-friendly dashboard examples are highlighted that you can use to elevate your client meetings. The images shown are RightCapital’s versions of these types of dashboards.
1. Tax savings analysis dashboard


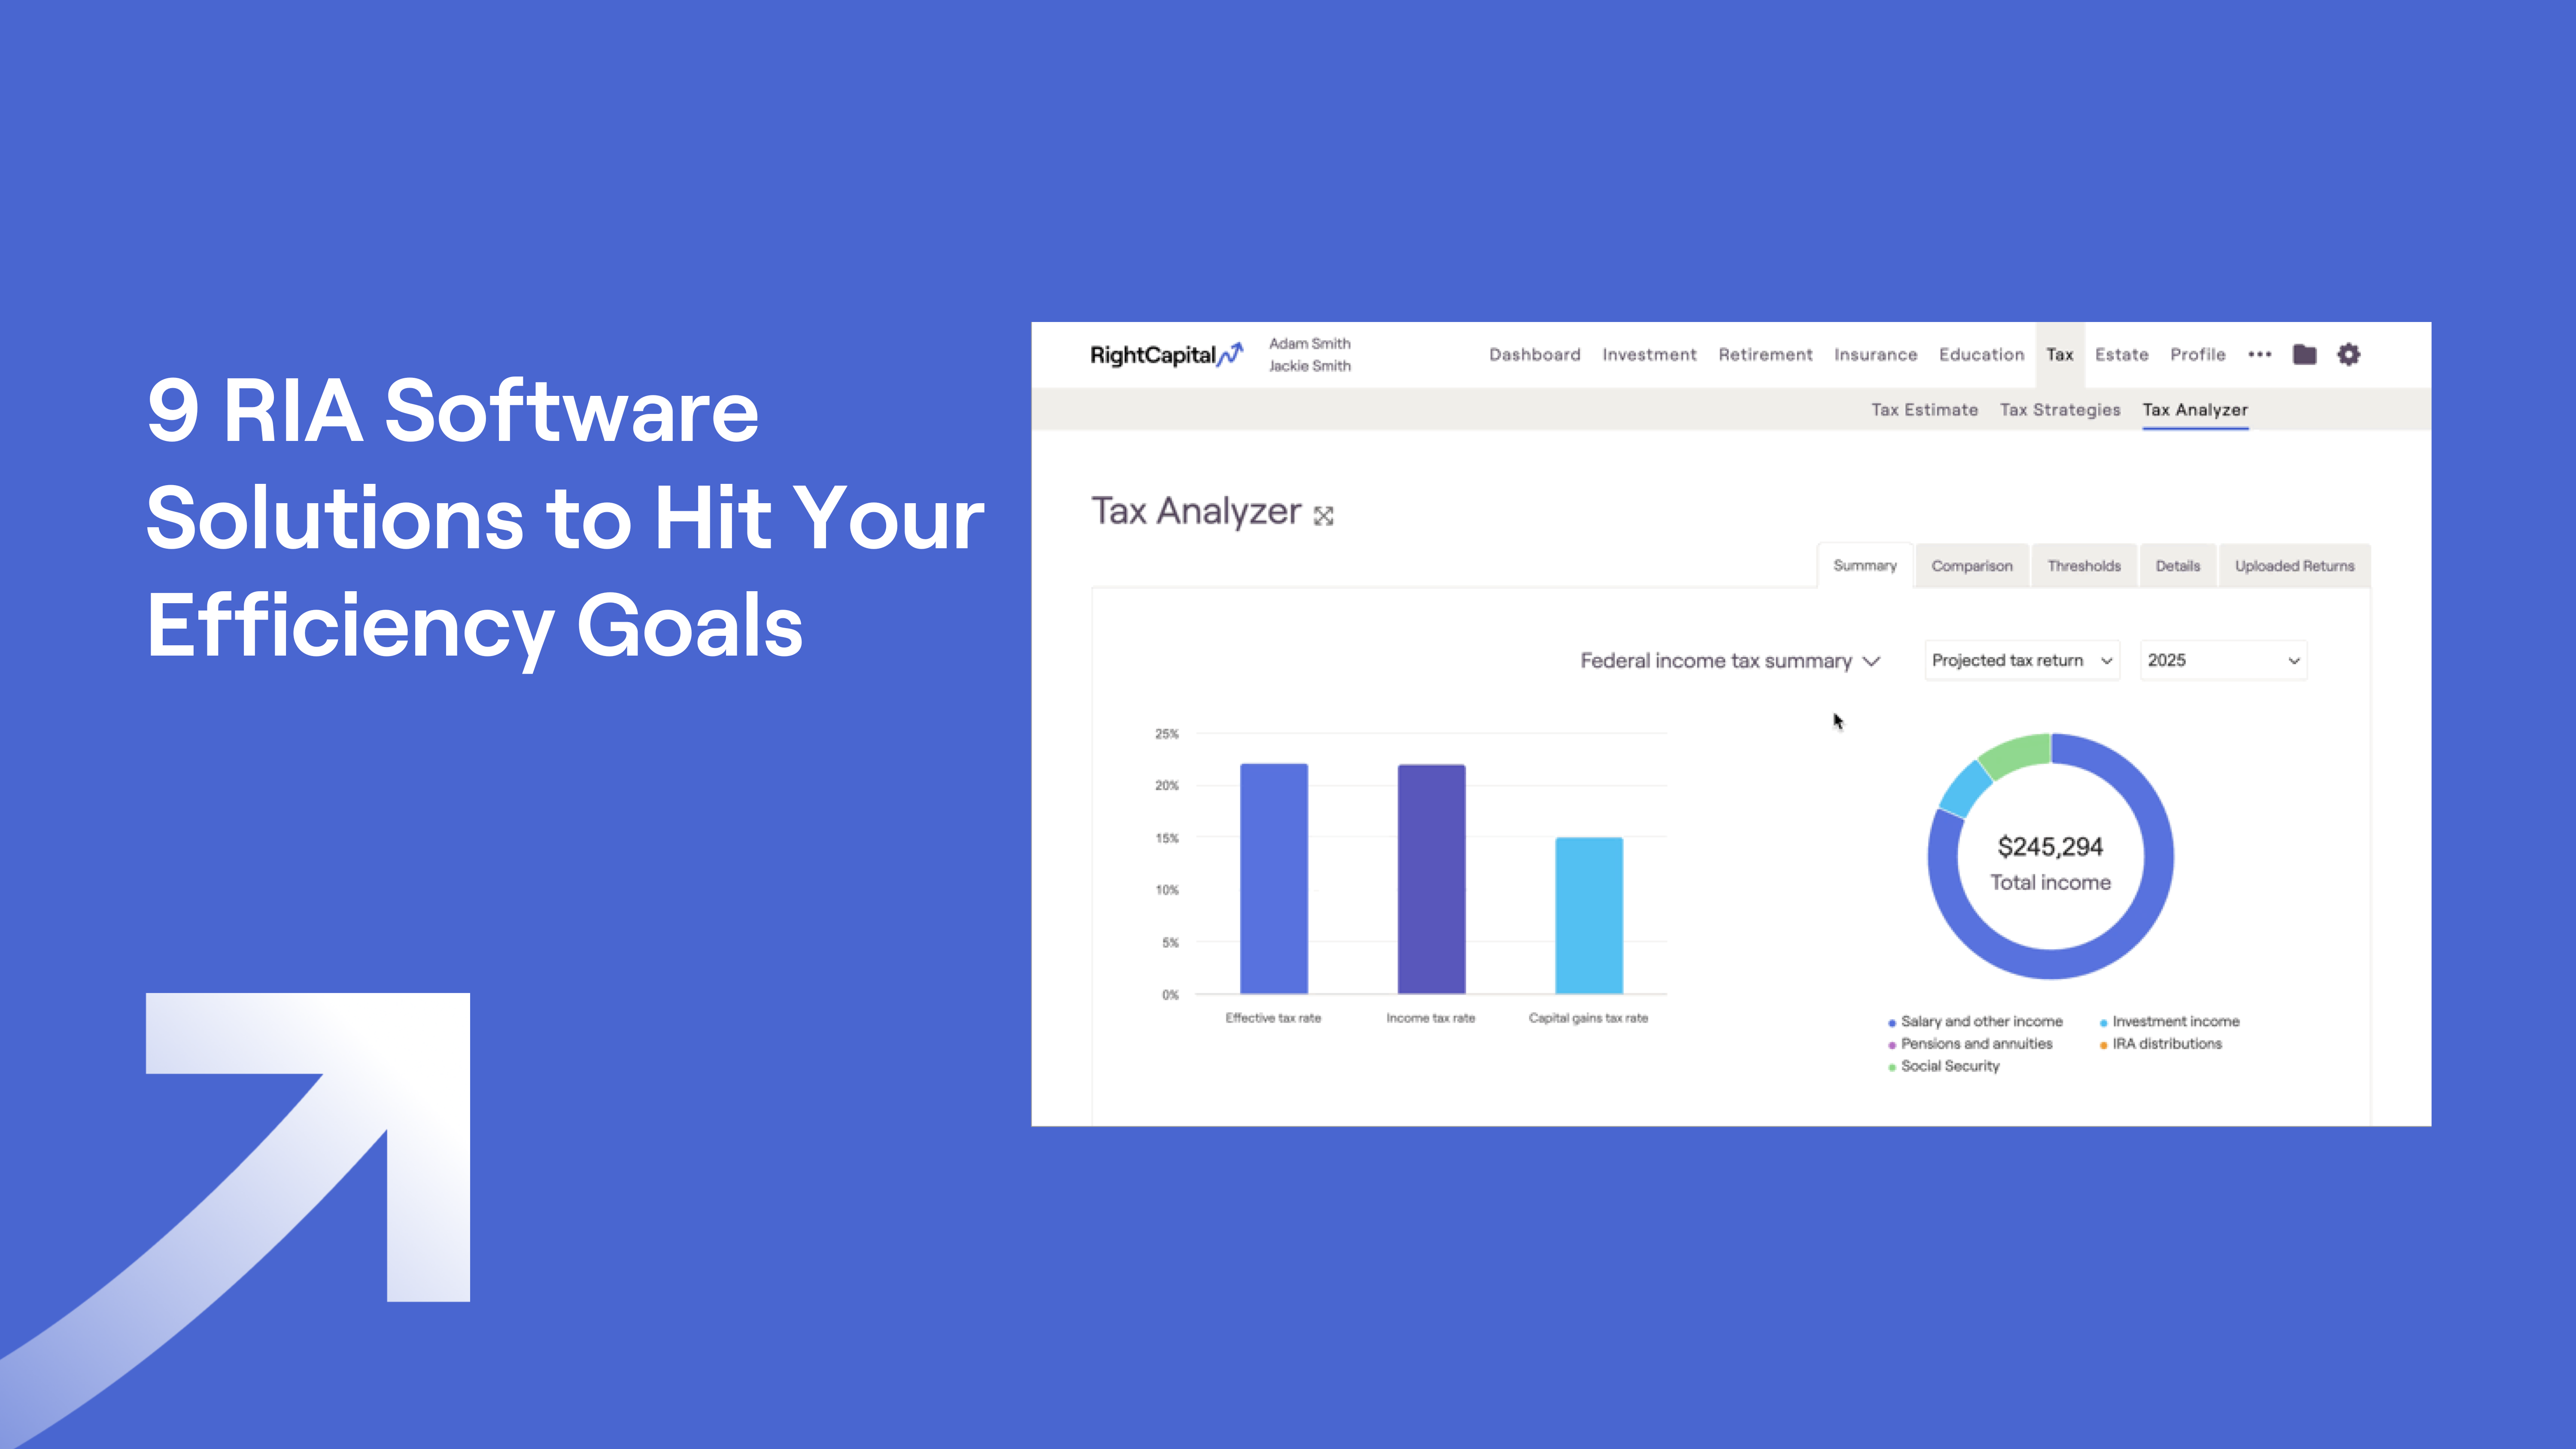
A tax savings analysis dashboard helps clients visualize the potential tax benefits of strategies such as Roth conversions, charitable giving, or tax-loss harvesting. Clients often worry about paying too much in taxes or missing out on savings opportunities. This type of finance dashboard demystifies tax planning and highlights actionable steps.
With RightCapital’s tax planning tools, you can efficiently pinpoint the most beneficial tax strategies for your clients and clearly illustrate their impact using intuitive, engaging visuals. Premium and Platinum subscribers can upload client tax returns into the platform for additional analysis using Tax Analyzer.
2. Retirement planning dashboards

Retirement planning dashboards provide a comprehensive, visual overview of a client’s retirement readiness by projecting future income, expenses, and portfolio performance. Clients gain confidence to make informed decisions to achieve long-term retirement goals.
By leveraging RightCapital’s Retirement Analysis, you can directly address your clients’ worries, provide clear projections, and inspire greater confidence in their financial future, helping to reduce stress and uncertainty.
3. Social Security optimization dashboard

A Social Security optimization dashboard helps advisors analyze different claiming strategies to maximize a client’s lifetime benefits. Clients can use this information to determine the optimal age and method for claiming benefits, aligning their Social Security strategy with their broader retirement goals.
With RightCapital, you can showcase the benefits of optimized Social Security withdrawals to help clients maximize their assets over time. This tool streamlines a complex process, enhancing your advice and reinforcing your expertise.
4. Stress test dashboard

A stress test dashboard allows advisors to model how a client’s financial plan would perform under various adverse scenarios. With these insights, clients can make informed decisions about risk tolerance, asset allocation, and contingency planning, ensuring their financial goals remain achievable even in challenging circumstances.
Within RightCapital, the Stress Test tool enables advisors to instantly illustrate the impact of different “what-if” scenarios such as market downturns, reduced benefits, or rising inflation, helping clients visualize the resilience of their plan and confidently adjust strategies as needed.
5. Cash flow dashboard

A cash flow dashboard provides a clear year-by-year breakdown of inflows and outflows. Clients who feel overwhelmed by their finances can quickly spot spending patterns and understand how changes impact their long-term goals.
RightCapital’s Cash Flow Map visualizations provide a detailed breakdown of every aspect of your client’s retirement plan to help clients see where their money is going and identify opportunities to save more.
6. Household financial health dashboard


Household financial health dashboards can show your client’s current state of affairs, taking into account assets and liabilities. Clients can track progress toward their goals and see the impact of your advice on their bottom line.
RightCapital’s Blueprint module offers an intuitive, client-friendly interface for entering and visualizing client data. By presenting essential financial details such as net worth, goals, income, savings, and expenses, it helps clients clearly understand the foundation of their financial plan.
7. Risk tolerance assessment

A risk tolerance dashboard visualizes a client’s risk profile and how it aligns with their current investment strategy. Clients can clearly see if their portfolio matches their comfort level, reducing anxiety and supporting more personalized recommendations.
With RightCapital’s Risk module (available with Premium and Platinum subscriptions), including its customizable questionnaires and scoring system, you can help clients gain a clearer understanding of their personal risk tolerance and build greater confidence in your personalized recommendations.
8. Budgeting dashboard

Budgeting dashboards break down spending by category, helping clients stick to their plans and adjust as needed. Clients who struggle with overspending or want to save for specific goals can see exactly where to adjust their spending habits.
RightCapital’s Budget Analysis tool within Premium and Platinum subscriptions enables clients to establish a healthy budget and easily track their monthly expenses, all seamlessly integrated within their financial plan.
9. Education funding dashboard

An education funding dashboard enables advisors to project future education costs, evaluate savings strategies, and track progress toward funding goals. Clients can use these projections to decide how much to save, which accounts to use (such as 529 plans), and how to balance education funding with other financial priorities.
RightCapital’s Education Funding Analysis makes it easy to incorporate education costs for every member of a client’s household, enabling you to create a personalized funding strategy tailored to each individual’s needs.
10. Student loan payment planning dashboard

Student loan payment planning dashboards show repayment options, projected payoff dates, and the impact of extra payments. Clients with student debt can visualize the benefits of different strategies and feel empowered to tackle their loans.
With RightCapital’s student loan analysis tool, advisors can help clients gain a clear understanding of their student loans, model a variety of repayment strategies, and seamlessly integrate these options into the client’s overall retirement plan.
11. Estate planning dashboard


Estate planning dashboards summarize wills, trusts, beneficiaries, and asset distribution plans. Clients gain peace of mind knowing their wishes are documented and their loved ones are protected.
The Estate flow chart within RightCapital helps visualize how assets will flow to a surviving spouse (and eventually to the client's heirs) in a dynamic environment. There is also an estate planning checklist to ensure that your clients are preparing the appropriate documents.
12. Insurance needs evaluation dashboard


Insurance needs evaluation dashboards assess coverage gaps and model the impact of insurance coverage on the client plan. Clients can see if they’re adequately protected and understand the value of recommended policies.
RightCapital’s insurance dashboards can model various types of coverage such as life, disability, and long-term care.
13. Debt management dashboard

Debt management dashboards track balances, interest rates, and payment strategies for all liabilities. Clients can prioritize high-interest debt and celebrate progress as balances decrease.
RightCapital’s dedicated debt management tool empowers advisors to clearly illustrate the impact of various debt reduction strategies, helping clients see the value of eliminating debt within their overall financial plan.
14. Equity compensation planning dashboard

Equity compensation dashboards help clients understand vesting schedules, tax implications, and diversification strategies for stock options or RSUs. Clients with equity awards can make informed decisions about exercising options and managing concentrated risk.
RightCapital’s dedicated Stock Plans module streamlines the analysis of client equity compensation, giving advisors clear insights into current grants and powerful tools to evaluate, present, and optimize stock plan strategies.
Best practices for customizing client financial reporting dashboards
Customizing finance dashboards ensures your outputs resonate with each client’s unique needs. Gone are the days of 60-page plans, here are the days of giving your clients exactly what they need when they need it.
RightCapital’s Snapshot is a great example of a customizable one-page plan, though you can certainly expand the number of pages if you wish. Snapshot widgets where you can highlight the financial dashboards and other key metrics and KPIs include: Savings rate, historical net worth, budget summary, liquidity, tasks, investment concentration, stress test, and income sources. There is also the option to include text and image boxes. Keep in mind you can create Snapshot dashboard templates for use across multiple households so you don’t have to reinvent the wheel for each plan.
RightCapital’s Snapshot tools make this process seamless, but these best practices apply to any platform:
Tailor financial dashboard visuals to client needs
Incorporate multiple data sources via platform integrations and manual input
Provide filters and sorts for the opportunity to drill down into details
Add context with notes for actionable insights
Offer multiple formats such as on-screen in real-time, PDFs, or printed reports
Set up automated alerts for when clients meet milestone ages
How to customize client financial reports in RightCapital
The above financial dashboards can be presented directly in a client meeting and also sent as a PDF, saved in the client vault, or printed in a report. RightCapital makes it easy to create and customize client reports. You can create a report by choosing which sections of modules you’d like to include and can drag and drop them around in the order you desire. If you have a report you’d like to duplicate for multiple client plans, you can create a report template. Within the report, you can also input full pages of text and customize your cover page.
Conclusion
Financial dashboards are essential for advisors who want to simplify complex data and empower clients to make informed decisions. RightCapital’s intuitive dashboards and customizable reports make it easy to present clear, actionable insights, no matter your client’s financial knowledge going into the conversation.
Ready to see how RightCapital can transform your client meetings? Book a demo and explore more interactive financial dashboards today.
Financial dashboard FAQ
Can I create a financial dashboard in Excel?
Yes, you can build basic financial dashboards in Excel or another spreadsheet program using graphs, pivot tables, and formulas. However, dedicated platforms like RightCapital offer more robust features, automation, and client-friendly visuals.
What finance data source integrations does RightCapital support?
RightCapital integrates with leading custodians, account aggregators, and portfolio management systems to automatically pull in banking, investment, and insurance data. See the full list of integrations.
What is a business intelligence dashboard?
While the dashboards above are for client consumption and understanding, a business intelligence (BI) dashboard within your financial planning software is a data visualization tool that aggregates and displays key metrics for your own book of business in real time. For example, RightCapital’s RightIntel (available in Premium and Platinum subscriptions) offers charts such as total number of clients, total invested assets, managed asset percentage, client demographics by age and employment status, and top clients by net worth, cash balance, logins to the client portal, and more.
Book a demo and explore RightCapital’s interactive financial dashboards to visualize plans and engage clients in real time.