Dynamic Retirement Spending Strategies: A Financial Advisor's Guide
August 7, 2026
Key Takeaways
- Real retirement spending shifts year to year instead of increasing with general inflation. A plan is more credible when it reflects that reality and client behavior.
- The main approaches are the retirement spending smile, spending stages (go-go/slow-go/no-go), Guyton-Klinger guardrails, and floor-and-ceiling, each backed by distinct research and suited to different client profiles.
- The right choice depends on the client's spending flexibility, longevity outlook, and comfort with year-to-year variability.
Retirement should be fun. It’s when a hard-worked life can be celebrated by traveling abroad, spending time with family, or focusing on a cherished hobby. But this time can often be overshadowed with concerns such as “Will I have enough money to last the rest of my life?” or “Should I be spending more now so that my hard-earned money doesn’t go to waste?”
Financial advisors can help alleviate these worries by incorporating dynamic retirement spending strategies into clients’ financial plans. In a time where nothing is certain, flexible strategies can help reinforce your client's confidence in their retirement.
Dynamic retirement spending strategies adjust a client's annual retirement spending to consider more factors than just inflation. The most widely used retirement spending strategies are the retirement spending smile, spending stages (go-go/slow-go/no-go), Guyton-Klinger guardrails, and floor-and-ceiling. This guide explains how each one works, the research behind it, and when it tends to fit a client best.
What is a retirement spending strategy?
A retirement spending strategy is the approach a financial plan follows to determine how much a client can reasonably spend each year in retirement and how that amount changes over time.
The simplest strategy is inflation-adjusted spending, where expenses rise in a straight line with inflation (a common default assumption is around 2.5% annually). This is a reasonable starting point and easy to explain, but it rarely matches how people actually spend once retired.
Why a flat, inflation-only assumption could fall short
While static strategies often adjust for an estimated inflation rate, they can fall short in addressing several uncertainties that shape a retirement:
- Market returns and the sequence in which those returns arrive are unpredictable.
- The inflation rate assumed today may look very different over a multi-decade horizon.
- The number of people in the US living to 100 is expected to quadruple by 2050, which stretches how long a portfolio has to last.
- Static strategies don't consider how spending changes over the length of retirement or how client behavior influences their spending habits.
Dynamic and behavioral strategies exist to model these patterns more realistically, so a plan reflects how a client is actually likely to live.
Modeling how spending changes with age
These two approaches aren't market-reactive. Instead, they capture the tendency for spending to shift as people move through the years of retirement. One thing to note about both: these strategies act on retirement living expenses specifically. Healthcare costs continue to rise with inflation, which is exactly why you still see spending tick back up late in the plan even as living expenses step down.
The retirement spending smile strategy
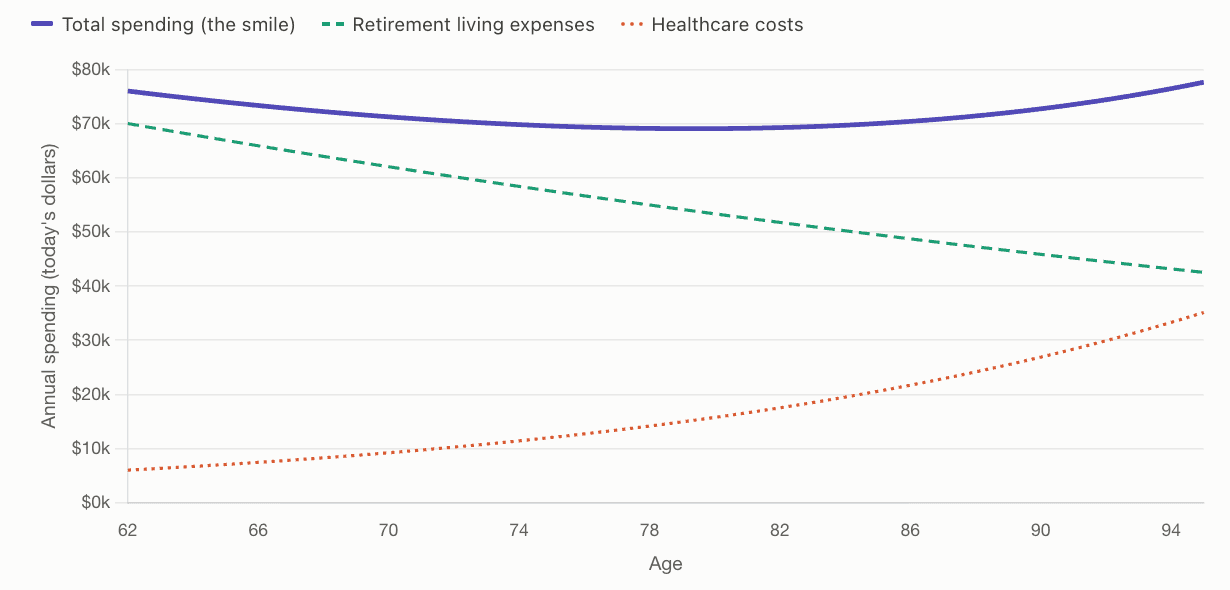
The insight comes from studying real household spending data rather than assuming a fixed rate. It suits advisors who are looking for a slightly more optimistic, evidence-based assumption about how discretionary spending fades over time.
Spending stages, aka “go-go, slow-go, no-go”
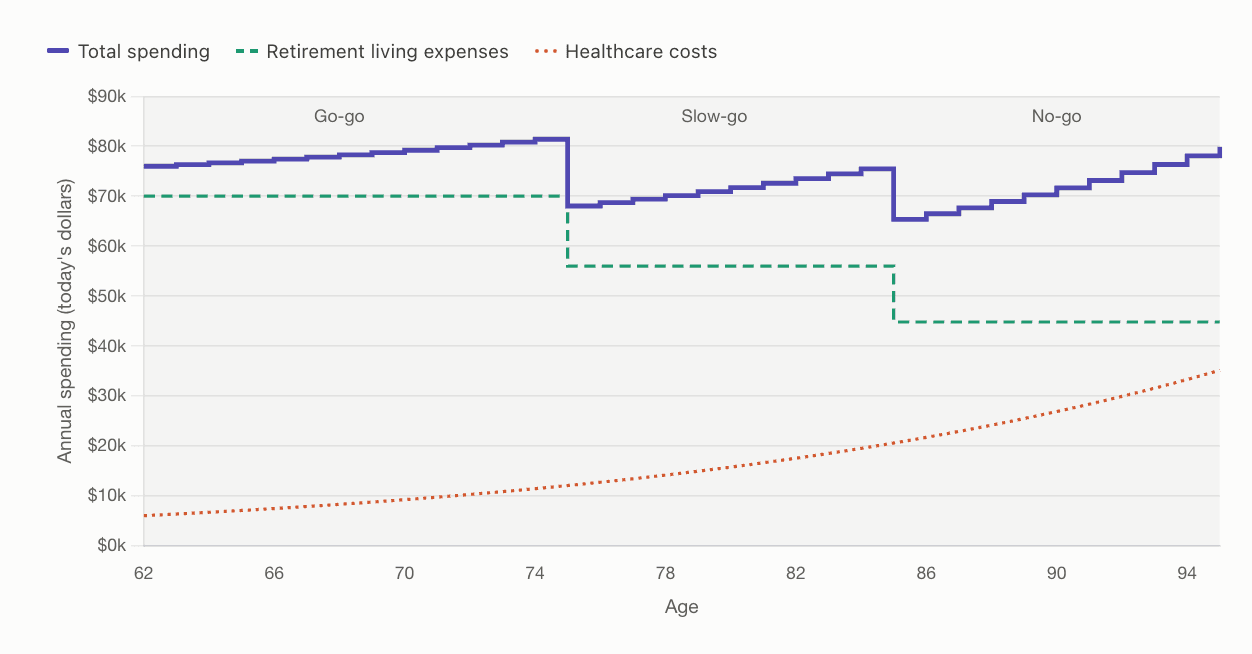
It's an intuitive way to account for the behavioral arc of aging. Clients often recognize themselves in it immediately—the early years of travel and bucket-list goals, a naturally quieter middle, and a later stage focused closer to home. The result is a clean, predictable "glide path" of step-downs that's easy to communicate.
Adjusting spending to the markets
These two approaches change spending in response to how the portfolio actually performs, allowing mid-course corrections that reduce the risk of overspending or unnecessarily underspending. They mirror how clients actually behave—pulling back when markets fall, spending more freely when they rise.
Guyton-Klinger guardrails strategy
%3Aformat(webp)&w=3840&q=75)
There's a behavioral benefit too. The rules are set in advance, so cutting back is a decision the client already agreed to. It also works in reverse since guardrails show clients how much they can spend without their portfolio running out. For someone who spent decades saving, permission to spend can matter as much as a plan for pulling back.
This guardrails withdrawal strategy is typically built from two rules working together, applied before a specified age, such as 80, so spending won’t swing dramatically later in life:
- The Capital Preservation Rule: If the current withdrawal rate climbs a specified percent above the initial or ideal withdrawal rate, spending is reduced by a specified percent the following year.
- The Prosperity Rule: If the current withdrawal rate falls a specified percent below the initial or ideal withdrawal rate, spending is increased by a specified percent the following year.
Both rules measure against that initial withdrawal rate, so it's worth checking that year one represents your expected barometer. A dream-home purchase, a milestone trip, or an inheritance can spike the rate in the year the benchmark is set, skewing every adjustment that follows. Being able to set an ideal rate to calculate guardrails off of, rather than relying on the natural one, keeps the guardrails more realistic.
There’s also a third “bonus” rule:
- The Inflation Rule: If the portfolio return is negative, you can choose not to apply an inflation adjustment to retirement expenses for the next year, so spending holds steady rather than automatically climbing.
This strategy allows the plan to incorporate both client behavior and your recommendations. It's the "modern guardrails" approach to retirement income that advisors can model directly in planning software.
Floor and ceiling strategy
%3Aformat(webp)&w=3840&q=75)
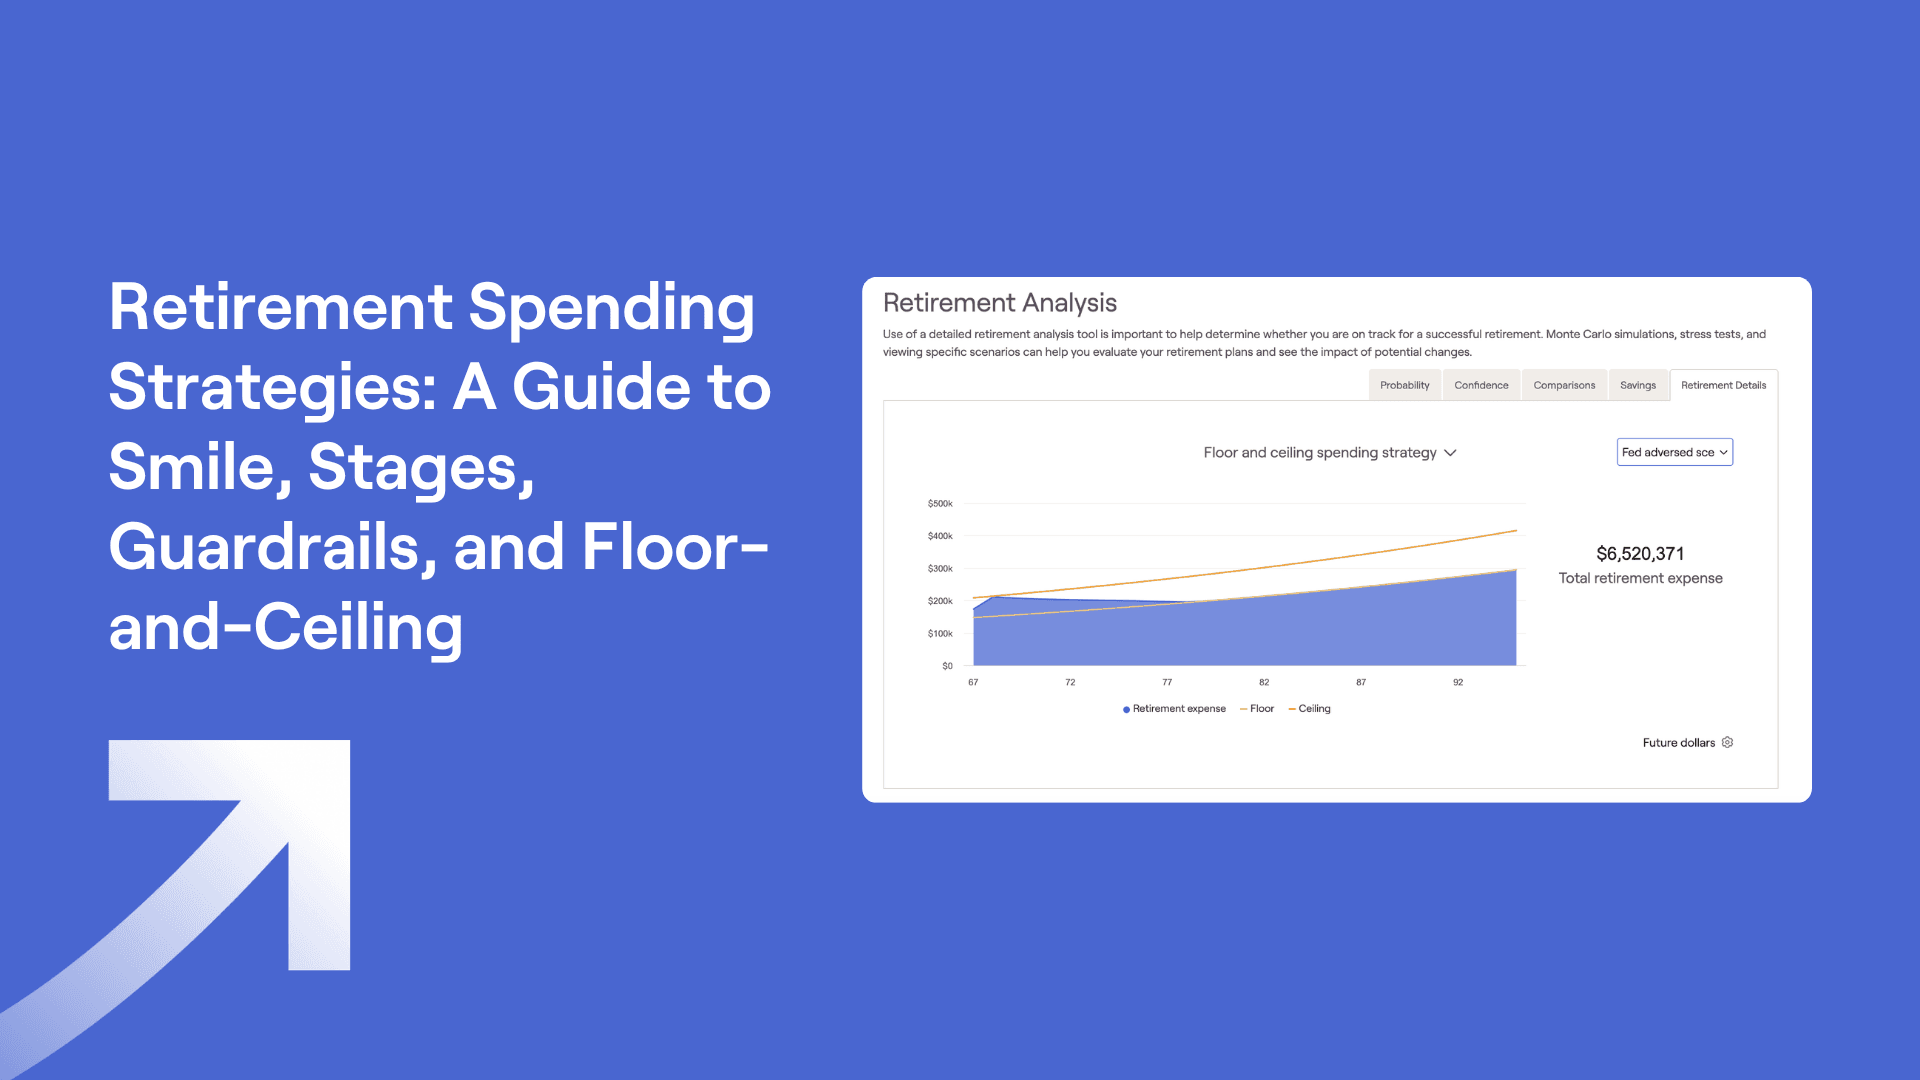
The key difference from the guardrails strategy is that guardrails adjust only when a threshold is crossed, while floor-and-ceiling holds spending within a specified corridor every year. Spending is reduced in down-market years, but no lower than the floor and increased in strong-market years, but no higher than the ceiling.
For example, a 15% floor keeps spending from dropping more than 15% below the initial retirement expense adjusted with inflation, while a 20% ceiling prevents it from rising more than 20% above. The boundaries give clients flexibility so they can consider spending more when the portfolio is performing well, while guaranteeing that spending doesn’t get loosey-goosey in either direction in any single year.
Which retirement spending strategy is best?
There is no single best retirement spending strategy. The right choice depends on the client's comfort with adjusting spending, their longevity outlook, and how much predictability they would like.
As a general guide:
If your client | Consider |
|---|---|
Prefers a predictable path | Spending smile or spending stages |
Is comfortable flexing with the markets | Guardrails or floor-and-ceiling |
It's worth stress-testing retirement strategies in more than one way:
- Probability of success comes from a Monte Carlo simulation running 1,000 trials of market volatility paths, indicating the percentage of those trials that make it to the end of plan without running out of money.
- Cash flow analysis applies a single defined market path (such as a bad decade followed by slow growth) to the year-by-year projection, answering the details of what a particular situation would actually look like.
Both views matter especially for guardrails and floor-and-ceiling, which visibly react to volatility.
Modern planning software makes it straightforward to model these side by side. In RightCapital, for example, you can adjust the parameters behind any retirement spending strategy, save your own named versions, and reuse them across plans, so a client with a different longevity outlook can have stages built to match.
Bringing it into your practice
Showing clients how their spending will change (and building a plan that adapts) is one of the most reassuring conversations an advisor can have. Whichever approach fits a given household, the goal is the same—a plan that gives clients confidence to enjoy their retirement while staying resilient through whatever the markets do.
If you'd like to explore how RightCapital models dynamic retirement spending, schedule a demo today:
%3Aformat(webp)&w=3840&q=75)
%3Aformat(webp)&w=3840&q=75)
%3Aformat(webp)&w=3840&q=75)
%3Aformat(webp)&w=3840&q=75)